
Understanding Widgets on the Dashboard
The dashboard widgets on Swonkie allow you to visualize and organize your brand’s data in a practical and personalized way. Each type of widget presents information uniquely, helping you draw insights and make strategic decisions based on the available data.
Below, we explain the different types of widgets available on Swonkie and how to use them in your day-to-day operations.
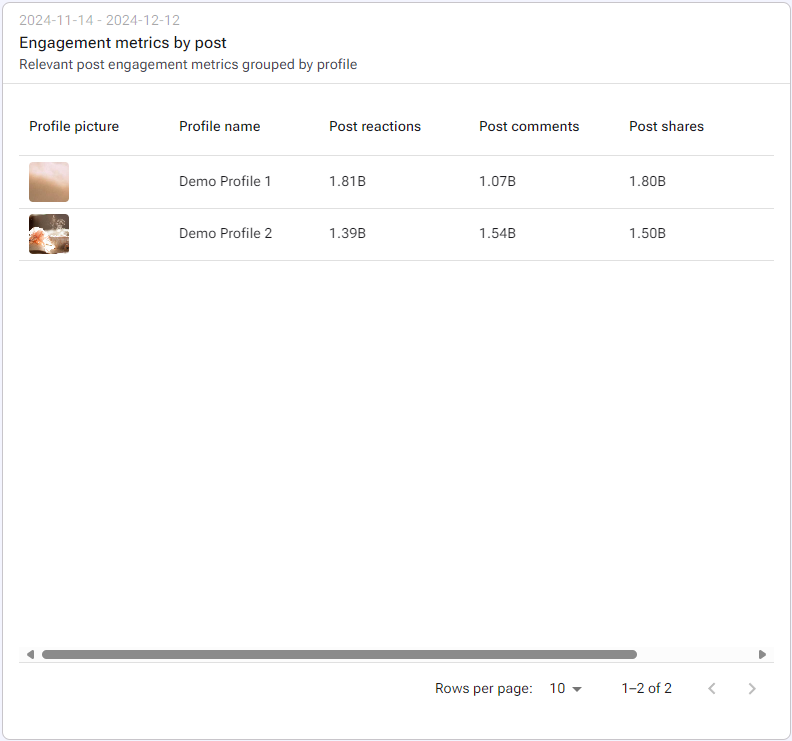
1. Tables
Tables are ideal for presenting data in a detailed and organized way, allowing for more granular analysis.
How you can use them:
- Compare metrics like clicks, reactions, and comments from multiple posts.
- Compare metrics across different profiles in an organized manner.
- Sort data in ascending or descending order for quicker and more effective analysis.
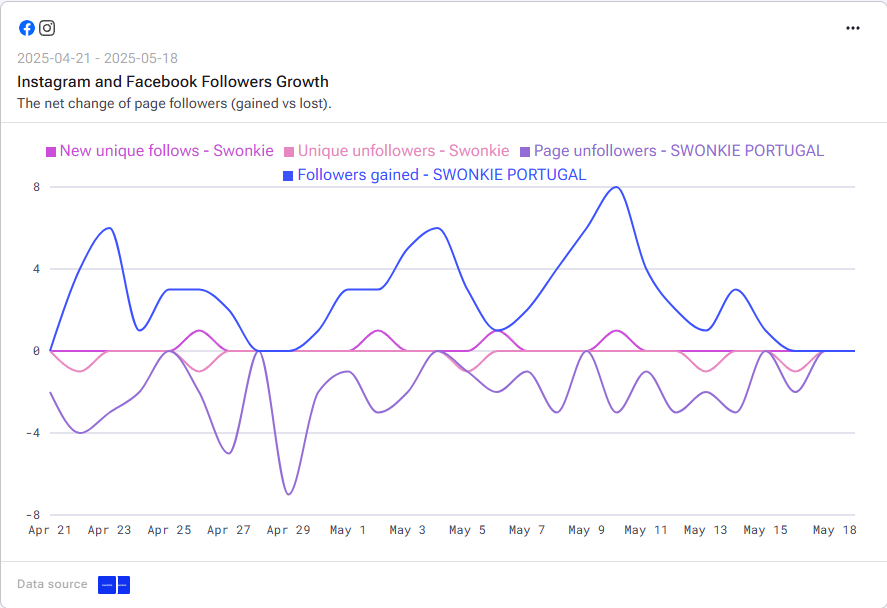
2. Line or Bar Charts
Line or bar charts are perfect for tracking the evolution of metrics over time or comparing data from different profiles.
How you can use them:
- Track the growth of followers, reach, or daily impressions.
- Monitor spikes or drops in metrics over time.
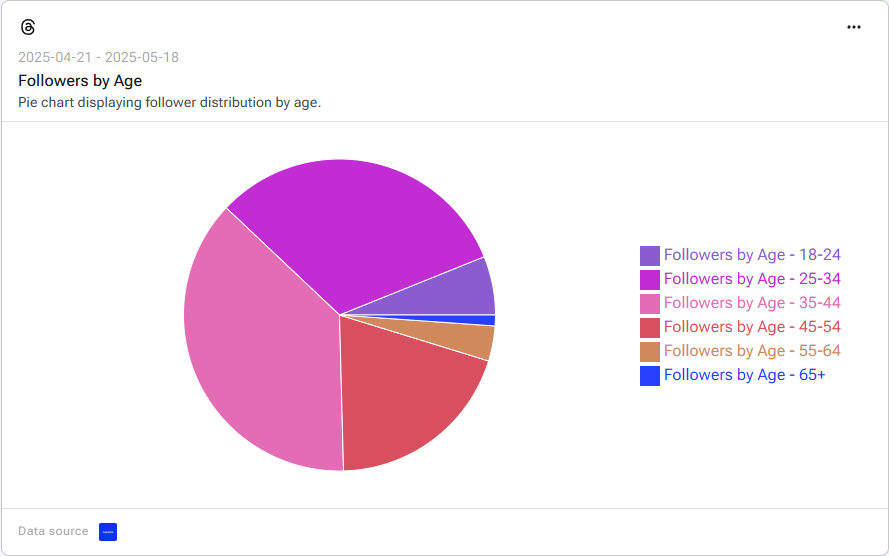
3. Pie Charts
Pie charts are great for showing the composition or distribution of a metric.
How you can use them:
- Visualize the proportion of reactions (likes, shares, comments) on posts.
- Analyze audience segmentation or any percentage-based metric.
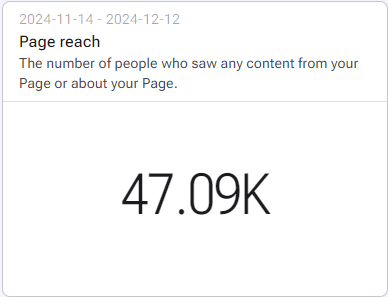
4. Big Numbers Widgets
Big number widgets display key totals, averages, or rates in the spotlight.
How you can use them:
- Monitor key metrics like total followers, growth rate, or average reach.
- Get a quick, clear overview of your brand’s overall performance.
- Identify the most relevant KPIs with a simple glance.
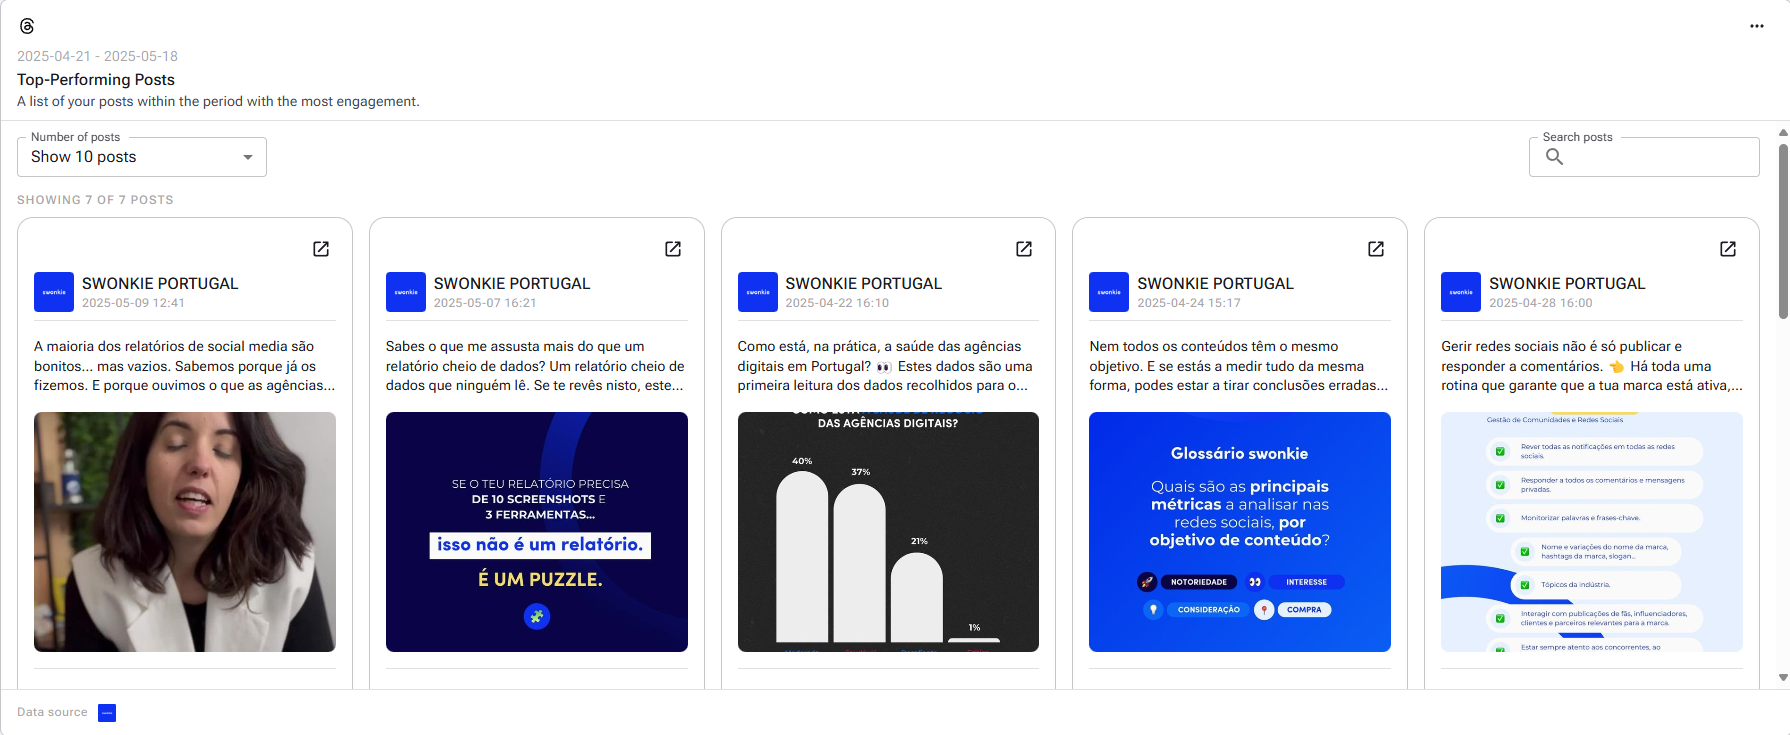
5. Feed Chart
The feed chart displays posts visually, allowing you to quickly analyse the performance of each piece of content.
How you can use it:
- View top-performing posts, along with data such as date, text, interactions, etc.
- Quickly identify which types of content deliver better results.
Tips for Using Widgets Effectively
- Combine different widget types: Use charts to see trends, tables for details, and big number widgets for a quick overview.
- Personalize your dashboard: Adjust the widgets to reflect the most important metrics for your goals.